Watch These Bitcoin Price Levels as Cryptocurrency Drops Below $80K Amid Tariff Worries
- April 6, 2025
- Category:
Key Takeaways
Bitcoin ( BTCUSD ) dropped below the closely watched $80,000 level on Sunday evening, tracking U.S. stock index futures sharply lower amid intensifying worries about the impact of tariffs.
The pioneer cryptocurrency plunged 5% to around $79,000 as market participants braced for further market volatility after China on Friday responded to the Trump administration’s recently announced sweeping tariffs with retaliatory duties, heightening concerns of a drawn-out trade war that could trigger a worldwide recession .
Bitcoin also continues to face selling pressure from liquidations, an event where falling prices force traders to sell their bullish bets on the cryptocurrency at a loss. According to crypto analytics site CoinGlass , bitcoin has suffered $250 million in long liquidations over the past 24 hours, the highest amount since March 7. Bitcoin has tumbled 15% year to date after more than doubling last year on expectations of regulatory tailwinds.
Below, we take a closer look at bitcoin’s chart and apply technical analysis to identify key price levels worth watching out for amid a tariff-driven global market selling rout.
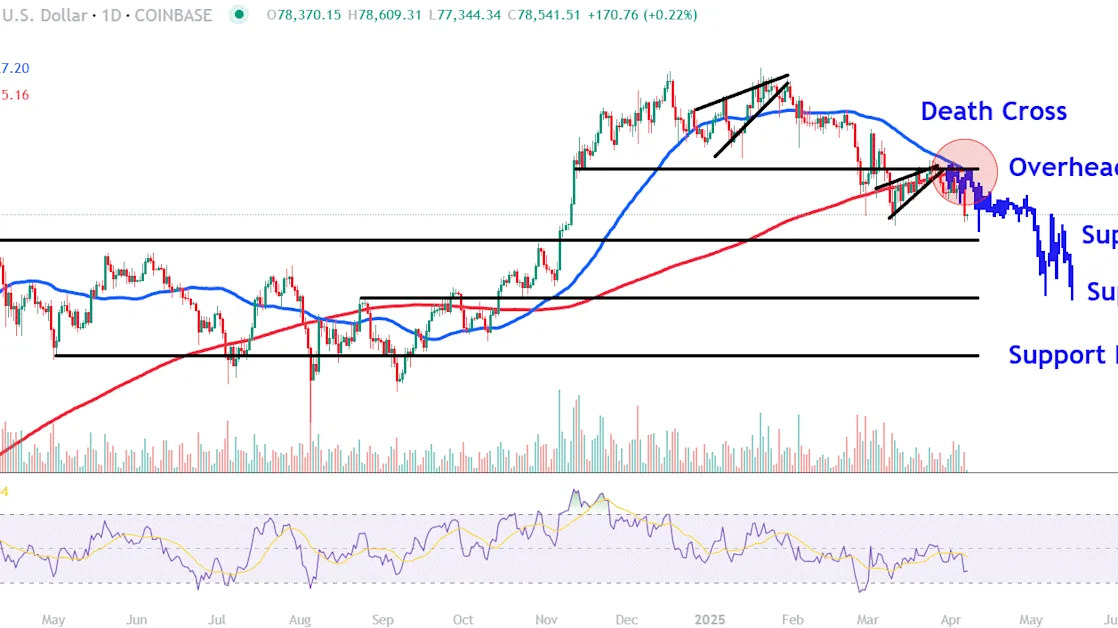
Death Cross in Focus
After falling below the 200-day moving average (MA) last month, bitcoin’s price consolidated within a rising wedge before breaking down below the bearish pattern in late March, signaling a continuation move lower.
Indeed, the cryptocurrency’s price has continued its downtrend , with declines accelerating on Sunday evening after a brief period of sideways drift . It’s also worth pointing out that the 50-day MA has crossed below the 200-day MA to form an ominous death cross , a chart pattern that warns of further selling.
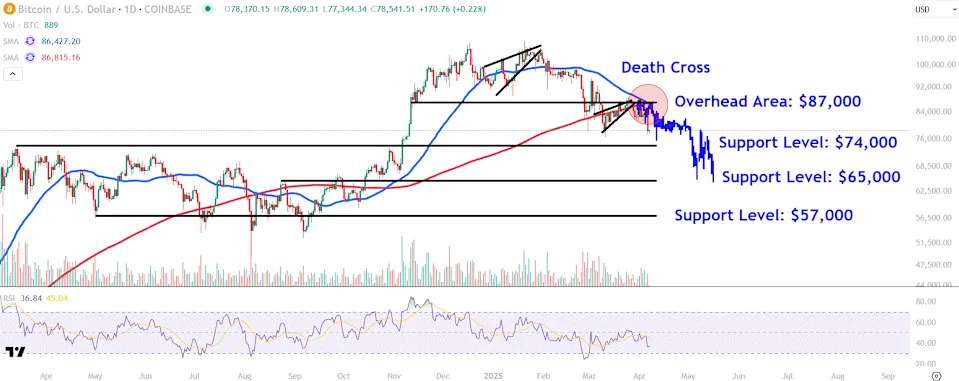
Let’s identify three key support levels on bitcoin’s chart that investors may be watching and also locate a major overhead area to eye during potential recovery efforts in the cryptocurrency's price.
Key Support Levels to Watch
A breakdown below last month’s low could see a move to around $74,000. This area on bitcoin’s chart may provide support near a multi-month trendline that connects last year’s prominent March peak and late-October high that preceded November’s election-fueled breakout.